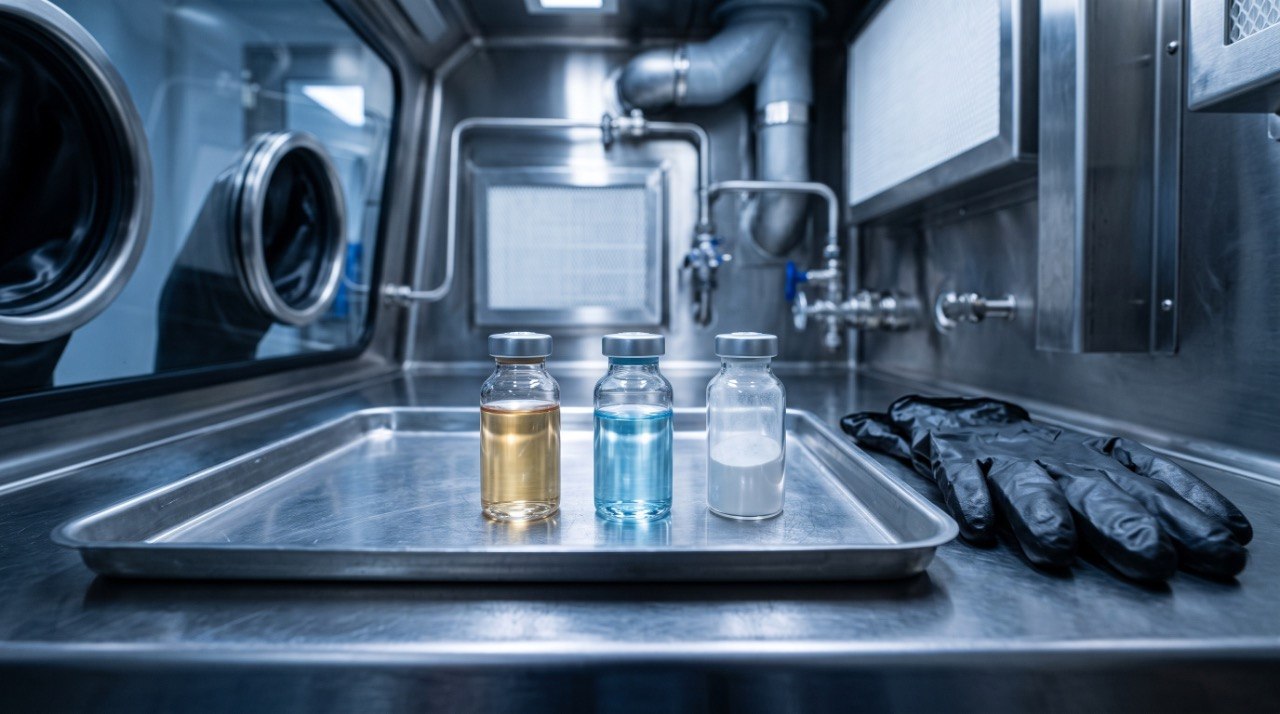
At-line TOC, in-line UV and automated process capability monitoring are moving cleaning data from a laboratory result reported days later to a signal produced during the cycle. A close reading of what is proven, what standards actually require, and what remains a promising research proposal.
Standfirst — Cleaning validation has always reported backwards: swab the surface, send the sample to the laboratory, read the result days later, then decide whether the batch was clean. At-line total organic carbon, in-line UV and automated capability monitoring put the number inside the cleaning cycle instead. The instruments exist and their performance figures are published. What is far less settled is which parts of that shift a regulator currently expects, and which are still a well-argued promise.
What is actually changing
The change is not new chemistry; it is where the measurement sits, and therefore what it means. A laboratory swab result is a proxy — recovery studies and rinse volumes stand in for a surface you never measured. A fluid-stream measurement is a different object, and the two are not interchangeable merely because both report a number in the same units.
Three shifts appear in the published record. Deployment: TOC can now sit on the bench, next to the vessel, or in the clean-in-place (CIP) skid. Continuity: in-line UV follows a cycle from soiled rinse to baseline rather than confirming cleanliness after the fact. Interpretation: automated collection is being paired with process capability statistics and language-model assistance for report narratives.
Each carries a different maturity: deployment is operational today, continuous monitoring works at pilot scale, and automated capability monitoring remains a published research proposal deployed in one company's environment.
The technology landscape
TOC: the same instrument, three sampling chains
A Veolia/Sievers Resource Center comparison published 23 April 2025 defines exactly three common TOC deployments: laboratory, at-line, and online. At-line is a portable analyser beside the equipment, measuring swab or rinse samples within minutes and bypassing the QC workflow, reducing idle time. Online is analysis of the final-rinse slipstream, with CIP automation diverting rinse to an integrated analyser and exporting data to the site data host; release time moves from days to minutes, and each measurement yields inorganic carbon, TOC and conductivity at once.
The limits of that speed matter. TOC is non-specific — one number for everything oxidisable, its strength and the reason "real time" must be read carefully. Real time here means the rinse residue profile as it develops, not an answer about a vessel wall that was never wetted. USP <643> requires TOC technology with a limit of detection of 0.05 mg/L C or lower. ASTM E2656-25 formalises what an online measurement must demonstrate before it carries a release decision for the TOC attribute of pharmaceutical water.
In-line UV: continuous, but only dissolved residue
A STERIS-authored article in Pharmaceutical Technology (29 July 2025) reports in-line UV absorbance at 220 nm through a sanitary flow cell, moving from a 1 cm cuvette to a 10 cm flow path for roughly a ten-fold absorbance increase under Beer–Lambert. Reported limits: alkaline cleaner LOD 5 ppm / LOQ 25 ppm; acid cleaner LOD 5 ppm / LOQ 10 ppm; upper analytical range 1000 ppm. Interference testing with native and denatured monoclonal antibody drug substance, insulin drug product and bovine serum albumin showed cleaner and soil responses to be additive, with soil-to-cleaner absorbance ratios of 0.60 to 0.96. In a dynamic test on a 60 L vessel, absorbances above 4.0 during cleaning returned to baseline, below 0.02, within one minute of rinsing.
The constraints matter as much as the numbers. The method is non-specific, so all signal must be attributed to the single worst-case component, which biases toward failing; foam or air entrainment can reduce effective pathlength. And because the measurement is taken in the fluid stream, it cannot distinguish dissolved from entrained residue, cannot reach unwetted locations and says nothing about the microbiological state. The authors are all STERIS employees, and the figures lack independent replication.
Automated collection and narrative generation
A January 2026 AAPS PharmSciTech paper by Xiande Yang, Wendy Lou and Mohamed Chan describes specification-limit normalisation for non-parametric process capability analysis, applied to a Stage 3 continued cleaning process verification case. Its authors state the model is deployed in an Azure Databricks production environment, drawing on LIMS and QMS inputs via a SQL warehouse, able to run daily, with R Quarto reports and narrative summaries produced by functions or a large language model via API.
Read that precisely. The paper describes bootstrap-assisted non-parametric percentile estimation and LLM-assisted report narration. It does not describe a machine-learning model trained on cleaning data. The AI framing is thinner than the statistical substance underneath it — and the statistical substance is what makes the data useful.
What standards expect today versus what technology promises
Established expectation today. EU GMP Annex 15 Sections 10.6.1–10.6.2 permit non-specific methods such as TOC and conductivity where specific residue testing is not feasible — the footing for at-line and online TOC. PIC/S PI 006-4, published 30 July 2026 and in force 1 October 2026, gives cleaning validation a dedicated Chapter 7: 7.9.2 states swab sampling is generally more effective than rinse sampling and should be employed if feasible; 7.13.2 requires cleaning verification after every change-over for products whose maximum allowable carry-over limits fall below the limit of visual detection. ASTM E3106-22 provides the lifecycle frame and states analytical method selection should be science- and risk-based and fit for use. ASTM E3470-25 expressly allows PAT tools to be evaluated for assessing cleaning adequacy.
Promise, not requirement. No current text requires in-line UV, requires a process capability index, prescribes a monitoring statistic, or requires automated daily capability runs. FDA's PAT guidance of October 2004 is explicitly non-binding. ASTM work item WK92658 records its own rationale bluntly: "There are no standards or guidance on how to use process capability for evaluating cleaning processes" — and a work item is a declared intention, not a published standard. The joint EMA/PIC/S revision of Annex 15 remains a concept paper running to April 2028 and creates no new requirement today.
The honest position: the standards have stopped prescribing the shape of cleaning evidence and started demanding its justification. They do not tell you to buy an in-line probe — but they do require that whatever you use can detect the carry-over it claims to control.
The statistics that make data useful
More measurements do not automatically produce more insight: in a multi-product programme a residue value carries no risk meaning alone, only the pair of residue and its own allowable limit. A process passing by a factor of two and one passing by five hundred look identical in a pass/fail table but carry very different risk.
The AAPS method expresses each result as a percentage of its own upper specification limit — DAR_Pct = (DAR/USL) × 100 — collapsing heterogeneous limits onto one relative risk scale at 100%. Capability is then estimated non-parametrically by kernel density estimation (Silverman bandwidth 1.06 s n^(−1/5)), giving Ppu = (100 − P0.5)/(P0.99865 − P0.5). The authors report process Ppu of 2.159 by subgroup-wise worst case, 2.568 by CQA-wise worst case and 2.699 by CQA-wise pooling, from a Stage 3A dataset of 10–11 cleaning events with three DAR specification limits of 169.7, 122.2 and 20 µg/swab. Shapiro–Wilk testing confirmed deviation from normality, the stated justification for non-parametric methods. The authors also state that using a single intermediate specification limit for all measurements constitutes a data integrity issue.
For monitoring, a bootstrap variant derives a 95% confidence interval lower limit from 1,000 iterations, refined to 10,000 if needed, and that interval — not a point estimate — becomes the threshold: Ppu ≥ CIL capable, 1 ≤ Ppu < CIL warning, Ppu < 1 not capable. WK92658 frames the same constraints from the standards side: one-sided specifications, small datasets, and non-detect handling that must be a pre-specified decision rather than whatever the spreadsheet did by default, because substituting zero, the LOD, half the LOD or LOD/√2 yields materially different capability values from one dataset.
Data integrity and alarm logic
Automated collection raises the stakes rather than lowering them, because data now arrive without a human at the point of generation. The AAPS deployment describes its own controls: validation under GAMP 5 and GAMP 5 AI with 21 CFR Part 11 expectations, URS, risk-based assessment, IQ/OQ/PQ, change control and periodic review. Reports are reproducible but not user-editable, with authorship assigned to the human who submits them.
Two limitations belong in any specification. Non-parametric methods are sensitive to repeatability and bandwidth selection, and identical cluster runtimes are required across users for consistent output — the authors cite Databricks runtime 16.1 versus 16.4 shifting decimal precision. LLM-assisted narrative, meanwhile, belongs in the reporting layer only, change-controlled and separated from the calculation. The governance question is not "does the model work" but "who owns the number, and what happens when it moves".
Alarm logic is where most programmes are weakest. A monitoring signal with no written response is worse than none, because it documents that you saw drift and did nothing; what is needed is a pre-defined distinction between warning and not-capable, an investigation trigger, and a re-evaluation cycle.
What this means for programmes
Do not let technology precede the sampling strategy. Ask which acceptance criteria are surface-based, in µg/cm² or "visually clean", and therefore not addressable by a fluid-stream measurement at all. A wall that was not wetted is not measured, whatever the probe cost.
Justify the analytical panel as a set, not method by method. A 2025 PDA Week lightning talk by Brian Bosso (STERIS) framed the lean-panel argument, and the independent framework already exists. Replacing 1/1000th-dose and 10 ppm criteria with HBEL-based limits frequently raises the permissible residue level, making non-specific methods adequate where a specific HPLC method was once mandated. Lean panels are more often a consequence of correct HBEL work than of cost pressure — but one that cannot show its arithmetic is not lean, it is undocumented.
Define the validated state as an object — equipment train, product set, worst case, procedure and agent as written, dirty and clean hold times, maximum campaign length, sampling plan, and analytical methods whose detection capability is adequate for the lowest carry-over limit in the family. Monitoring frequency and method specificity should be traceable outputs of a documented risk assessment, not policy defaults.
Fazit
The data shift is real, but it is a shift in measurement position and interpretation, not a transfer of responsibility to an instrument. At-line and online TOC genuinely compress release time from days to minutes. In-line UV genuinely follows a cycle continuously, provided you accept that it sees dissolved residue only. Automated capability monitoring genuinely offers a defensible way to pool multi-product Stage 3 data — as one published candidate method, not a requirement. Keep promising technology on one side of the line and established regulatory expectation on the other, and the intelligence in process intelligence will come from the statistics and governance, not the label.
Sources
- Yang X, Lou W, Chan M. Specification Limit Normalization for Nonparametric Process Capability Analysis, AAPS PharmSciTech 2026;27:87. https://link.springer.com/article/10.1208/s12249-025-03267-5
- Schallom J et al. In-line UV Spectrometry Monitoring in Cleaning Validation, Pharmaceutical Technology, 29 July 2025. https://www.pharmtech.com/view/in-line-uv-spectrometry-monitoring-in-cleaning-validation
- Veolia/Sievers Resource Center, 23 April 2025. https://www.watertechnologies.com/sievers-resource-center/cleaning-validation-lab-compare-to-online-atline
- ASTM WK92658, https://store.astm.org/workitem-wk92658 ; ASTM E3470-25, https://store.astm.org/e3470-25.html ; ASTM E3106-22, https://store.astm.org/e3106-22.html ; ASTM E2656-25, https://kpt-bj.com/astm-e2656-25-standard-practice-for-real-time-release-testing-of-pharmaceutical-water-for-the-total-organic-carbon-attribute-2074039248.html
- FDA PAT guidance, October 2004. https://www.fda.gov/regulatory-information/search-fda-guidance-documents/pat-framework-innovative-pharmaceutical-development-manufacturing-and-quality-assurance
- PIC/S PI 006-4, 30 July 2026, in force 1 October 2026. https://picscheme.org/en/news/adoption-and-entry-into-force-of-new-pics-guidance-documents
- STERIS Life Sciences, PDA Week 2025 session listing. https://www.sterislifesciences.com/Events/2025/April/PDA-Week-2025
Validation takeaway
The data shift is real but it is a shift in measurement position and interpretation, not a transfer of responsibility to an instrument. At-line and online TOC genuinely compress release time from days to minutes, and in-line UV genuinely follows a cleaning cycle continuously — provided it is understood as dissolved-residue-only monitoring that cannot reach unwetted surfaces or speak to microbiological state. Automated capability monitoring, illustrated by the 2026 AAPS specification-limit-normalisation work, is a published candidate method for pooling multi-product Stage 3 data with bootstrap confidence-interval thresholds, not a requirement; its own authors flag non-detect handling, bandwidth sensitivity and fixed cluster runtimes as conditions. What standards require today is narrower: a science- and risk-based, fit-for-use method selection, demonstrated detection capability against the lowest carry-over limit in the family, and justified continued verification. Keep promising technology on one side of the line and established regulatory expectation on the other, document which side each element of your programme stands on, and the intelligence in process intelligence will come from the statistics and governance rather than from the label.
Questions worth asking in our own programme
- Which of our acceptance criteria are surface-based (µg/cm², visually clean) and therefore not addressable by a fluid-stream measurement at all, however good the probe?
- If we deployed at-line or online TOC, which residue would we designate as the worst case for the non-specific signal, and what is its response factor against our acceptance limit?
- Do we hold a written comparability protocol for transferring a validated laboratory TOC method to at-line or online deployment, including sample origin and hold-time changes?
- For any in-line UV application, what baseline profile have we measured on our worst-case product and cleaner combination, and have we measured the soil-to-cleaner absorbance ratio rather than assuming additivity?
- If a monitoring signal deviates, do our procedures define what happens next — hold, investigate, re-clean — and is there a written investigation trigger?
- Which of our cleaning processes have a documented capability index with a lower confidence bound, and which have only a pass/fail conclusion?
- How do we currently treat non-detect results in any capability or trending calculation, and is that rule written into the protocol before the data arrive?
- Would our Stage 3 monitoring threshold be a point estimate or a confidence interval lower limit — and how do warning and not-capable signals differ in response?
- For any automated or AI-assisted cleaning monitoring, is the computational environment (software versions, runtime, bandwidth and kernel settings) fixed, documented and change-controlled so that outputs are reproducible?
- Is the LLM-assisted narrative in any automated report change-controlled and separated from the calculation, with a named human accountable for the submitted report?
- When was our analytical panel last justified as a set rather than method by method, and what is the ratio between each method's LOQ and the current HBEL-derived surface limit?
- Can we distinguish, in writing, the technology we have adopted because a regulator expects it from the technology we have piloted because it promises more?